Sports Betting Success Indicators: Consumer Behaviors
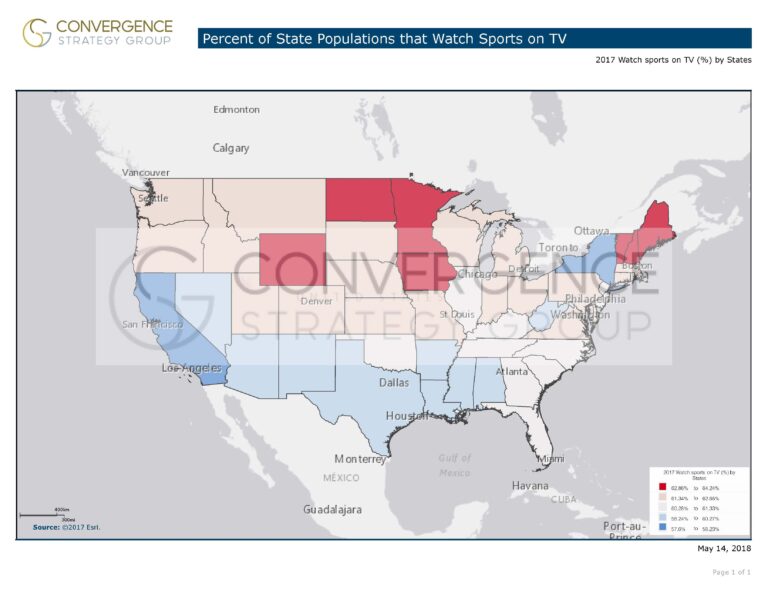
Fresh off the heels of some great discussions on sports betting over the weekend, I’ve put together a few quick graphics that shed some light on the potential for the legalized sports betting market. Utilizing proprietary consumer behavior data, with the Gulf Coast as an example, the above maps demonstrate:
- the prevalence of adults to gamble in a casino in 2018;
- the prevalence of adults to use their cell phones to check sports scores (read: mobile market) AND gamble in a casino in 2018; and
- the prevalence of adults to participate in fantasy sports AND use their cell phones to check sports scores AND gamble in a casino in 2018.
For each variable, these maps show in blue the counties and parishes with a score of 85 or higher (a value of 100 represents the US average); counties and parishes not shown in blue scored lower than 85.
In general, the more data and information we can draw from, the more informed our decisions can be. When considering the potential legalization of sports betting across the states in our country, a view of these and any of the thousands of demographic, psychographic, consumer spending, and business performance data sets can help to highlight its potential for success.
See also:
http://convergencestrat.com/now-what-mapping-the-opportunities-in-sports-betting/
http://convergencestrat.com/opportunities-in-sports-betting-part-2/
Suzanne Perilloux Leckert, AICP
Managing Partner